
Company valuation tools for M&A: a practical breakdown and what to look for
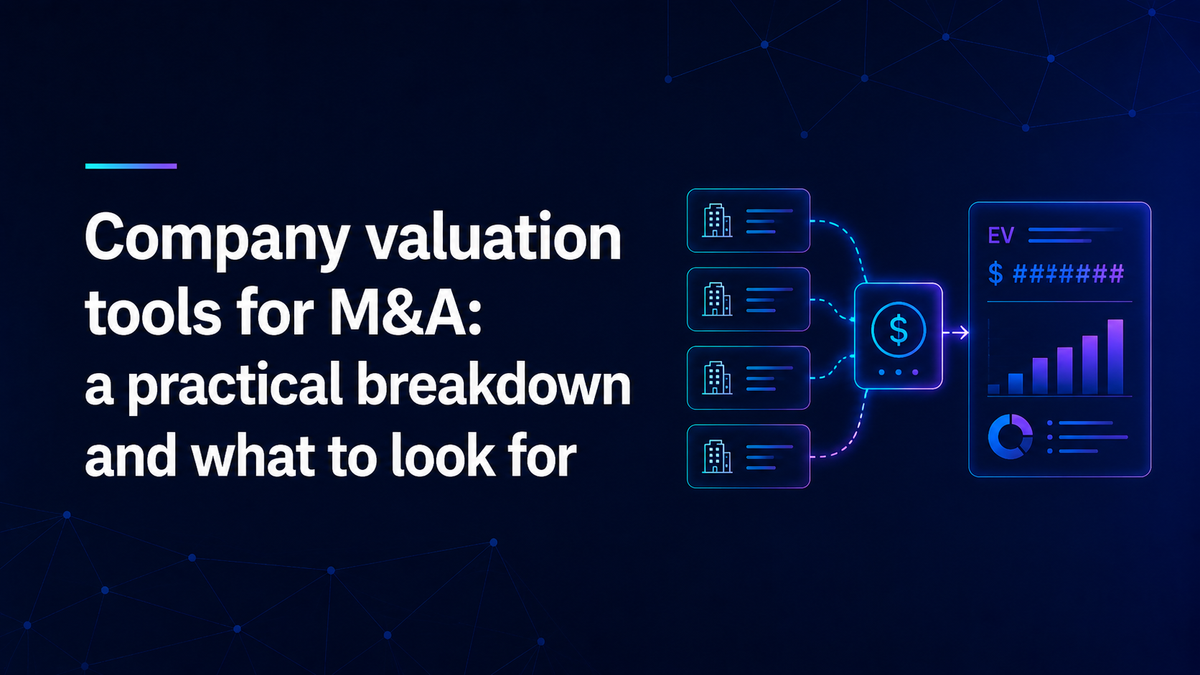
Valuation is the point in any deal process where analytical quality becomes most visible. A valuation range presented to an investment committee, a board, or a counterparty needs to be defensible on methodology, traceable on data, and consistent when revisited. That is a higher bar than most general tools are built for.
This is a practical breakdown of what a serious valuation tool needs to cover, where most approaches fall short, and what purpose-built platforms deliver that ad hoc or manual approaches cannot.
Why valuation in M&A is harder than it looks
The core challenge is that every element of a multiples-based valuation depends on something upstream being right. If the peer group is wrong, the multiples are wrong. If the financial data is inconsistent across the peer set, the comparisons are misleading. If size adjustments are not applied, smaller companies get valued at multiples that do not reflect their actual risk profile.
Most valuation work in M&A still involves significant manual effort: identifying peers across multiple sources, normalising financial data to a comparable basis, calculating median multiples, and assembling a Football Field. That process is time-consuming, variable by analyst, and difficult to reproduce exactly.
The result is valuation analysis that is often solid in intent but inconsistent in execution. The same target, valued by two different analysts using the same general approach, can produce meaningfully different ranges depending on which peers were selected and how the multiples were calculated.
What a professional valuation tool needs to deliver
Peer identification based on actual business model, not sector codes
Peer selection is the foundation of any multiples-based valuation. Get it wrong and nothing else in the analysis holds.
The standard approach relies on sector classification codes: NACE, SIC, GICS, or similar systems. The problem is that these codes were designed for statistical classification, not competitive analysis. A sector code can group companies with structurally different business models, margin profiles, and growth dynamics. The resulting peer group reflects how companies are labelled, not how they actually compete.
StrategyBridgeAI's Hawk Eye identifies peers using semantic analysis of business model characteristics across a universe of around 50 million private and public companies. The peer group reflects actual competitive and structural similarity, not administrative classification. For niche and mid-market companies where sector codes provide limited signal, this distinction produces materially better valuation inputs.
Multiples that are calculated, not estimated
A credible valuation requires multiples drawn from a defined peer set and applied with documented methodology. The key multiples in an M&A context are EV/Sales, EV/EBITDA, EV/EBIT, and P/E, calculated across both trading comparables from listed peers and transaction comparables from recent M&A deals.
Hawk Eye calculates all of these deterministically. For each multiple, the platform derives median values across four groups: sector trading multiples, transaction multiples, peer company trading multiples, and peer company transaction multiples. The median of these medians forms the basis for the indicative valuation. Size and profitability adjustments are applied where relevant to ensure the multiples reflect the scale of the target company, not just the average of a broader peer set.
Every multiple traces back to its source: listed company filings or verified transaction records from the last five years. The calculation is documented and reproducible.
A Football Field that shows the full picture
The Football Field chart is the standard output for presenting valuation ranges to investment committees and boards. It shows the implied enterprise value range under each valuation methodology, making visible both the central estimate and the spread across methods.
Hawk Eye produces this output automatically. The chart visualises the minimum and maximum implied EV from each multiple category, with the median marked as the central estimate. Decision-makers can see at a glance where the methods converge and where they diverge, and what drives the difference.
That transparency is what makes a valuation presentable. A range with a visible, traceable methodology holds up in a committee discussion. One without it does not.
Management plan plausibility alongside the valuation
A valuation that does not test the forward assumptions underlying it is incomplete. If the target's business plan projects margin expansion or revenue growth that no comparable company has achieved, that should be visible in the valuation analysis, not discovered separately.
Hawk Eye's forecasting module sits within the same workflow as the valuation. Management projections are compared against peer trends and market data, making it clear where the plan is consistent with sector experience and where it requires explanation. This does not replace the financial due diligence, but it structures the right questions earlier in the process.
Output delivered in the client's own design
Valuation analysis that requires significant reformatting before it reaches a client adds time and creates version control risk. Hawk Eye delivers all outputs, including the multiples table, Football Field, and benchmarking visuals, directly in the user's own PowerPoint design. The analysis is presentation-ready from the moment it is generated.
The quality standard that valuation work requires
Valuation used in professional contexts, whether for an M&A advisory opinion or a credit decision, carries professional liability. That liability creates specific requirements for how the analysis is produced and documented.
Deterministic output. Identical inputs must produce identical outputs. A valuation that produces different results on re-run cannot be reliably defended or shared internally with confidence that the numbers are consistent.
Source citation per data point. Every multiple, every financial figure, every peer company included in the analysis should trace back to a specific, dated, verifiable source. StrategyBridgeAI classifies sources by quality tier and validates data before it enters any calculation.
Reproduced methodology. The method applied should be documented sufficiently that a qualified reviewer can follow the logic from input to output. That is the standard for audit-grade analysis, and it is increasingly the standard expected in any professional context where the valuation informs a decision.
StrategyBridgeAI is listed by the Institut der Wirtschaftsprüfer (IDW), which reflects the quality and compliance standard the platform is built to. It is used by more than 150 clients across M&A advisory, private equity, audit firms, and corporate banking.
"We are significantly faster and have access to more comprehensive, structured data for longlists, benchmarking and valuation."
Dr. Volker Riedel, Dr. Wieselhuber & Partner
How valuation tools are used across the deal workflow
First-view valuation in early-stage screening. Before committing to full diligence, a quick outside-in valuation based on verified peer multiples informs the go/no-go decision. Hawk Eye delivers this in a fraction of the time manual research requires.
CDD and red flag due diligence. Outside-in valuation alongside competitive benchmarking surfaces misalignment between management's implied valuation expectations and what the market would actually support.
Sell-side pitch preparation. A credible, documented valuation range is a core deliverable in any sell-side mandate. Hawk Eye produces it in the advisor's own design, ready for the first client conversation.
Frequently asked questions: valuation tools for M&A
What is a multiples-based valuation in M&A?
Multiples-based valuation estimates a company's enterprise value by multiplying its financial metrics (revenue, EBITDA, EBIT, net income) by multiples derived from comparable companies and transactions. The key multiples are EV/Sales, EV/EBITDA, EV/EBIT, and P/E. The reliability of the output depends on peer selection quality and data accuracy.
What is a Football Field chart in M&A valuation?
A Football Field chart visualises the implied enterprise value range under each valuation methodology. Horizontal bars represent the minimum and maximum EV implied by each multiple category, with the median marked as the central estimate. It is the standard output format for presenting valuation ranges to investment committees and boards.
How does StrategyBridgeAI calculate valuation?
Hawk Eye derives median multiples across four groups: sector trading, sector transactions, peer company trading, and peer company transactions. The median of these medians forms the indicative valuation basis, with size and profitability adjustments applied where relevant. Every multiple traces to a verified primary source. Output is deterministic: identical inputs always produce identical results.
What makes a valuation tool audit-grade?
Audit-grade valuation requires source citation per data point, documented and reproducible methodology, deterministic output, and GDPR-compliant data handling. StrategyBridgeAI meets all of these requirements and is listed by the Institut der Wirtschaftsprüfer (IDW).
How quickly can StrategyBridgeAI produce a full valuation analysis?
A complete outside-in analysis including peer identification, benchmarking, multiples-based valuation, Football Field, and management plan plausibility is available significantly faster than traditional manual approaches. The output is delivered in the client's own PowerPoint design, presentation-ready without reformatting.
Does StrategyBridgeAI cover private company valuation?
Yes. Peer identification draws on around 50 million private and public companies globally. Private companies are included in both the peer group and in transaction comparables where data is available, making the platform particularly useful for mid-market and niche valuations where listed peer coverage is limited.
See how StrategyBridgeAI's Hawk Eye module handles valuation, benchmarking, and outside-in analysis.
More from this category
Explore related insights from StrategyBridgeAI.

Quality of earnings analysis in M&A: what it is and what it actually adjusts
A practical guide to quality of earnings (QoE) analysis in M&A: what it checks, the EBITDA adjustments that matter most, and how to screen a target before you commission a formal report.
Red flag due diligence: how to screen an acquisition target before the data room opens
Most deal risks are visible long before the data room opens. Here is how M&A, advisory and audit teams run a structured red flag screen while a target is still a name on a longlist.
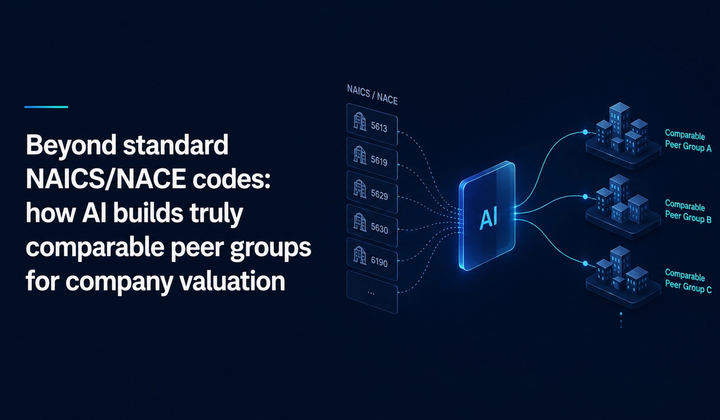
Beyond standard NAICS/NACE codes: how AI builds truly comparable peer groups for company valuation
Classic NAICS/NACE codes lump niche providers into peer groups that don’t fit. See how AI-driven classification builds comparables analysts can confidently defend.