
How to benchmark an acquisition target against peers with different business models
By
Lisa
Pull up almost any teaser or CIM and you will find an EBITDA margin benchmarked against “the industry.” The problem is that a 15% EBITDA margin can be mediocre for one business model and exceptional for another, even inside the same four-digit industry code.
This shows up constantly in corporate development, M&A advisory and private equity due diligence: a target gets compared to peers that look similar on a sector report but run on fundamentally different economics, asset intensity or growth-versus-profitability trade-offs. The benchmark is technically correct and practically useless.
In this article you'll learn:
- The difference between industry benchmarking and peer group benchmarking, and when each one is reliable
- Why comparing an asset-light business to asset-heavy peers (or vice versa) distorts EBITDA margin, leverage and return comparisons
- How the Rule of 40 works for software businesses, and why it breaks down outside SaaS
- What a defensible peer group looks like for a private company, on both business and financial characteristics
- How to turn a benchmark into a realistic improvement target instead of a static snapshot
- Where AI-driven peer grouping helps when standard industry codes fall short
How to benchmark an acquisition target against peers with different business models
Industry benchmarking and peer group benchmarking answer different questions, and mixing them up is one of the most common mistakes in financial due diligence.
Industry benchmarking compares a company against a broad sector classification. It is useful for spotting overall trends and understanding where valuation premiums or discounts in a sector come from. But because the group includes many different business types, the result is directional, not precise.
Peer group benchmarking narrows the comparison to companies with a similar market segment, customer base and business model. It is more granular and far more useful for judging competitive position, efficiency and a realistic improvement path, which is exactly what a due diligence team or an operating partner needs.
Industry benchmarking vs. peer group benchmarking
| Dimension | Industry benchmarking | Peer group benchmarking |
|---|---|---|
| Scope | Broad sector classification (e.g. NACE, SIC, GICS code) | Narrow set of genuinely comparable companies |
| Precision | Directional, shows overall trends | Granular, supports specific conclusions |
| Best used for | Spotting sector-wide premiums, discounts and cycles | Judging competitive position and setting targets |
| Main risk | Hides differences between dissimilar business types | Requires real work to find and validate true peers |
Why asset-light and asset-heavy companies need different benchmarks
Two companies can carry the same industry code and still be financially incomparable. A software business with minimal fixed assets and a machinery manufacturer with a heavy balance sheet will naturally show very different EBITDA margins, capital turnover and leverage ratios, without either one being badly run.
Treating both against one flat “industry average” EBITDA margin produces a number that is directionally meaningless. A credible benchmarking approach instead adjusts the KPI set to the business model: asset-light companies are better judged on growth-and-margin composites and capital efficiency, while asset-heavy companies need the comparison adjusted for capital intensity and asset structure before a margin difference means anything.
The same logic applies to leverage. A higher debt ratio is not automatically a red flag. For some business models it is a sign of an efficient capital structure; for others it signals real financial risk. KPIs like this need to be read as “inverted,” where a lower value is the better outcome, rather than assuming higher is always stronger.
The Rule of 40 and its limits outside software
The Rule of 40 is a widely used heuristic in SaaS and software investing: revenue growth rate plus profit margin should add up to at least 40%. It gives investors a quick way to judge whether a software company is creating value through growth, profitability, or a healthy mix of both, and it correlates reasonably well with valuation multiples in that sector.
It is a useful shortcut, but it has real limits that practitioners should know before reaching for it outside its home turf:
- It was built for growth-stage and later-stage software companies. It is largely irrelevant for early-stage companies still burning cash to find product-market fit.
- “Profit margin” is not strictly defined. Some use EBITDA margin, others free cash flow margin, and the choice can change the score meaningfully, which opens the door to companies picking whichever metric flatters them.
- It does not transfer well to capital-intensive or highly cyclical industries, where growth and margin trade off very differently than they do in software.
- It is purely quantitative. It says nothing about revenue quality, customer concentration or the durability of the growth.
For an M&A team evaluating a software target, the Rule of 40 is a reasonable sanity check alongside a proper peer benchmark, not a replacement for one. For any other business model, it should not be used at all without a clearly stated adaptation.
How to build a peer group that actually compares like with like
A peer group is only as useful as the care that went into building it. Analysts spend a disproportionate share of their time here for good reason: a perfect match rarely exists, so the goal is to find companies that share the characteristics that actually drive performance and risk.
That means checking both business characteristics and financial characteristics before trusting a comparison.
What to check before trusting a peer group
| Category | What to check |
|---|---|
| Business characteristics | Sector and sub-sector classification, geography, product mix, customer base, distribution model |
| Financial characteristics | Revenue scale, growth rate, margin profile, seasonality or cyclicality, leverage |
A single industry code is rarely enough on its own. Classification standards like GICS, NACE and SIC each slice industries differently, and a niche business can land in a misleading bucket under any one of them. Cross-checking a target against more than one classification standard, rather than taking a single code at face value, catches a meaningful share of false peer matches before they distort a benchmark.
For private targets, the peer set also has to rely heavily on companies' mandatory financial statement filings rather than analyst-covered public comparables, since the long tail of genuinely comparable mid-market companies is private. A peer group built only from listed companies systematically skews toward larger, better-covered businesses, which is misleading for a mid-market acquisition.
Setting a realistic improvement target, not just a diagnosis
Benchmarking a target tells you where it stands today. A deal team, and especially a private equity operating partner building a value creation plan, needs more than a diagnosis: a believable target for what “good” looks like within a realistic time frame.
The common mistake is anchoring that target to the theoretical best performer in the sector, a number that is motivating on a slide but rarely achievable within a hold period. A more defensible approach anchors the target to the next-best comparable company within a genuine peer group: a company facing similar market conditions and business model constraints that is already demonstrably outperforming the target. That is a target grounded in evidence, not aspiration.
This target also needs to account for where the company sits in its own lifecycle. A benchmark that is realistic for a company in a growth phase will usually be unrealistic for one in a restructuring situation, and vice versa. Comparing a company only to its static industry average, without adjusting for its stage, routinely produces targets that are either too easy or quietly impossible.
Where AI-assisted peer grouping helps
Building and maintaining peer groups this carefully, across multiple classification systems, at the scale needed for a live pipeline of targets, is difficult to do manually for every deal. This is one of the areas where AI-driven company data and benchmarking genuinely change the workflow rather than just speeding up a spreadsheet.
StrategyBridgeAI's company benchmarking analysis builds a peer group of typically 20 to 25 companies, up to a maximum of 60, drawn from public annual report filings, and classifies each company using multiple industry standards (GICS, NACE and SIC) rather than a single code, which helps catch the niche or cross-sector businesses that a rigid classification would misplace. Every KPI is shown against the peer average, with a clear marker for whether the underlying figure is a reported actual, an estimate, or a customer-supplied input, so the audit trail behind a benchmark stays visible rather than being buried in a black box.
The platform also adjusts the KPI set for business model, applying growth-and-margin composites for asset-light businesses and capital-intensity-adjusted comparisons for asset-heavy ones, and sets an improvement target based on the next-best company in the real peer group rather than a flat sector ideal. The underlying data draws on a company database covering roughly 46 million companies across the DACH region, the rest of Europe, Asia, North America, Latin America, Oceania and Africa, built primarily from official company and disclosure registers and supplemented by structured third-party data where no public register exists, which is what makes it possible to build a genuine peer group for a private, narrowly defined target rather than defaulting to the nearest public comparable.
Frequently asked questions
What is the difference between industry benchmarking and peer group benchmarking?+
Industry benchmarking compares a company to a broad sector classification and is useful for spotting overall trends. Peer group benchmarking compares it to a narrow set of companies with a similar business model, customer base and financial profile, which gives a more precise read on competitive position and realistic targets.
Can you use the Rule of 40 outside SaaS companies?+
Not reliably. The Rule of 40 (revenue growth plus profit margin at or above 40%) was built for growth-stage and later-stage software companies. It does not transfer well to early-stage companies, capital-intensive industries or highly cyclical sectors, where growth and margin trade off very differently.
How many companies should be in an M&A peer group?+
There is no fixed rule, but a peer group of roughly 20 to 25 companies, up to around 60, is generally large enough to be statistically meaningful while still staying genuinely comparable. Quality of the match matters more than hitting a specific count.
How do you benchmark a private company that does not publish detailed financials?+
Pull five years of data from mandatory public annual report filings rather than internal management accounts, mark clearly which figures are reported actuals versus estimates versus customer-supplied inputs, and widen the peer set using industry and regional averages where direct company-level peers are too thin.
What is a realistic KPI improvement target after an acquisition?+
Anchor it to the next-best comparable company in a genuine peer group, not the theoretical market leader, and adjust for the target's lifecycle stage. A target grounded in what a similar company has already achieved is far more credible in a value creation plan than an aspirational top-of-sector number.
More from this category
Explore related insights from StrategyBridgeAI.

Quality of earnings analysis in M&A: what it is and what it actually adjusts
A practical guide to quality of earnings (QoE) analysis in M&A: what it checks, the EBITDA adjustments that matter most, and how to screen a target before you commission a formal report.

Red flag due diligence: how to screen an acquisition target before the data room opens
Most deal risks are visible long before the data room opens. Here is how M&A, advisory and audit teams run a structured red flag screen while a target is still a name on a longlist.
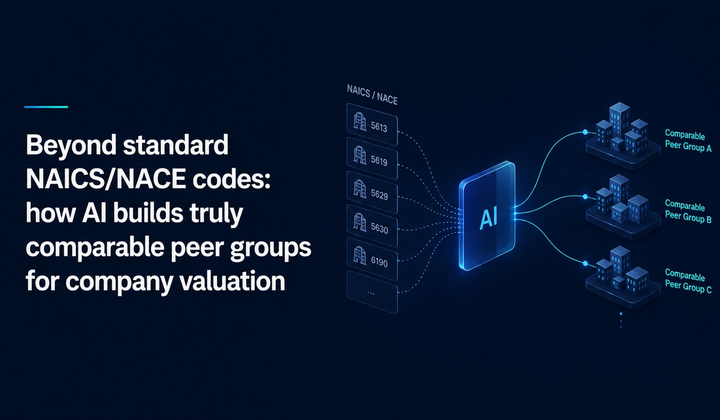
Beyond standard NAICS/NACE codes: how AI builds truly comparable peer groups for company valuation
Classic NAICS/NACE codes lump niche providers into peer groups that don’t fit. See how AI-driven classification builds comparables analysts can confidently defend.